This code show how to open an external web page. Evaluating if is an Desktop or Web Apllication.
using System.Runtime.InteropServices.Automation;
using System.Windows.Browser;
using Microsoft.LightSwitch.Client;
using Microsoft.LightSwitch.Threading;
var uri = new Uri("http://google.com", UriKind.RelativeOrAbsolute);
Dispatchers.Main.BeginInvoke(() =>
{
try{
// If is a Desktop application
if (AutomationFactory.IsAvailable){
var shell = AutomationFactory.CreateObject("Shell.Application");
shell.ShellExecute(uri.ToString());
}
// If is a Web application
else if (!System.Windows.Application.Current.IsRunningOutOfBrowser){
HtmlPage.Window.Navigate(uri, "_blank");
}
else{
throw new InvalidOperationException();
}
}
catch (Exception ex){
//handle the exception however you want
}
});
In case you want to open in the same page, use:
HtmlPage.Window.Navigate(uri, "_self");
viernes, 30 de agosto de 2013
jueves, 22 de agosto de 2013
BI - SSIS Expressions
Name a File dinamically
In connections (as a File) you can change the Output File name using expressions.
With the following expression you can named a file according with the actual date.
“C:\\Projects\\SSISPersonalTrainer\\EmployeeCount_”+
RIGHT( “0”+(DT_WSTR, 2) Month(GETDATE() ), 2 ) +
RIGHT( “0”+(DT_WSTR, 2) Day(GETDATE() ), 2 ) +
(DT_WSTR, 4) Year(GETDATE() )+”.txt”BI - Integration Services
Description of the SSIS Toolbox Items
Script Task
Just do a simple task and you can code some actions like evaluate some variables, also you can evaluate two Script task with AND or OR conditional.

File System Task
Can do all the actions to interact with a FTP.

Execute SQL
You can execute a sql sentence, also you can put the result in a variable or variables.

Execute Process Task
You can execute an external program like a *.bat where you can send it some parameters

Expression Task
Evaluate variables with many functions like Round, Sum, Date functions, etc. You can use it in a For Loop Container.

Send Mail Task
As the name say, you send an email with all the attributes you can imagen.

Data Flow
The Data Flow Task is used to transfer data from a source to a destination and can transform the data as needed.

Data Conversion
Transfor the data type, usefull in case of non-unicode to unicode

Devived Column
create or replace a column in the data stream

Aggregate
Rolling up data, with these you can Groups by the information. This element is the one who use the most memoty in the process.

Sort
Sort data based on any column in the Data Flow path

Look up
Perform the equivalent of an inner and outer hash join. The only difference is that the operations occur outside the realm of the database engine.

Row Count
Count the row and store the value in a variable to be used later, for example in an expression that evaluate if is bigger than cero then continue.

Union All
Combines multiple inputs in the Data Flow into a single output rowset. It is very similar to the Merge Transform, but does not require the input data to be sorted.

Script Component
Can manipulate the data:

Conditional Split
The Conditional Split Transform uses the SSIS expression language to determine how the data pipeline should be split. For this example, all you need to know is that the Conditional Split Transform is checking to see if customers have more than five kids so they can receive the extra coupon.

OLE DB Commmand
Is used to run a SQL statement for each row in the Data Flow

Fuzzy Lookup
Gives other alternatives to dealing with dirty data while reducing your number of unmatched rows. The Fuzzy Lookup Transform matches input records with data that has already been cleansed in a reference table. It returns the match and can also indicate the quality of the match. This way you know the likelihood of the match being correct.
NOTE A best practice tip is to use the Fuzzy Lookup Transform only after trying a regular lookup on the field first. The Fuzzy Lookup Transform is a very expensive operation that builds specialized indexes of the input stream and the reference data for comparison purposes. Therefore, it is recommended to first use a regular Lookup Transform and then divert only those rows not matching to the Fuzzy Lookup Transform.

Fuzzy Grouping
To examine the contents of suspect fields and provide groupings of similar words. You can use the matching information provided by this transform to clean up the table and eliminate redundancy.

Script Task
Just do a simple task and you can code some actions like evaluate some variables, also you can evaluate two Script task with AND or OR conditional.
File System Task
Can do all the actions to interact with a FTP.
Execute SQL
You can execute a sql sentence, also you can put the result in a variable or variables.
Execute Process Task
You can execute an external program like a *.bat where you can send it some parameters
Expression Task
Evaluate variables with many functions like Round, Sum, Date functions, etc. You can use it in a For Loop Container.
Send Mail Task
As the name say, you send an email with all the attributes you can imagen.
Data Flow
The Data Flow Task is used to transfer data from a source to a destination and can transform the data as needed.
Data Conversion
Transfor the data type, usefull in case of non-unicode to unicode
Devived Column
create or replace a column in the data stream
Aggregate
Rolling up data, with these you can Groups by the information. This element is the one who use the most memoty in the process.
Sort
Sort data based on any column in the Data Flow path
Look up
Perform the equivalent of an inner and outer hash join. The only difference is that the operations occur outside the realm of the database engine.
Row Count
Count the row and store the value in a variable to be used later, for example in an expression that evaluate if is bigger than cero then continue.
Union All
Combines multiple inputs in the Data Flow into a single output rowset. It is very similar to the Merge Transform, but does not require the input data to be sorted.
Script Component
Can manipulate the data:
- Transform—Generally, the focus of your Data Flow will be on using the script as a transform. In this role, you can perform advanced cleansing with the out-of-the-box components.
- Source—When the script is used as a source, you can apply advanced business rules to your data as it’s being pulled out of the source system. (This happens sometimes with COBOL files.)
- Destination—When the script is used as a destination, you can use the script to write out to a non-OLE DB destination, like XML or SharePoint.
Conditional Split
The Conditional Split Transform uses the SSIS expression language to determine how the data pipeline should be split. For this example, all you need to know is that the Conditional Split Transform is checking to see if customers have more than five kids so they can receive the extra coupon.
OLE DB Commmand
Is used to run a SQL statement for each row in the Data Flow
Fuzzy Lookup
Gives other alternatives to dealing with dirty data while reducing your number of unmatched rows. The Fuzzy Lookup Transform matches input records with data that has already been cleansed in a reference table. It returns the match and can also indicate the quality of the match. This way you know the likelihood of the match being correct.
NOTE A best practice tip is to use the Fuzzy Lookup Transform only after trying a regular lookup on the field first. The Fuzzy Lookup Transform is a very expensive operation that builds specialized indexes of the input stream and the reference data for comparison purposes. Therefore, it is recommended to first use a regular Lookup Transform and then divert only those rows not matching to the Fuzzy Lookup Transform.
Fuzzy Grouping
To examine the contents of suspect fields and provide groupings of similar words. You can use the matching information provided by this transform to clean up the table and eliminate redundancy.
martes, 20 de agosto de 2013
BI - Include a packake as a Job
After did your package, insert as a job in SQL Server
- Select in Visual Studio -> Save As

- Go to the file system and copy the file to C:\Program Files\Microsoft SQL Server\MSSQL11.MSSQLSERVER\MSSQL
- Go to SQL Server Manager
- Expand SQL Server Agent
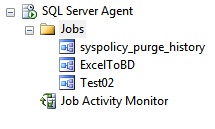
- Right click in Jobs
- Select New Job
- Type a Name

- Click in Steps
- Click in New
- Type a Name
- In Package select the file *.dtsx

- In the Tab "Execution options", select "Use 32 bit runtime"
- Click OK

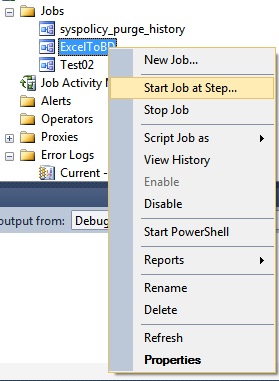
- In Jobs do right click and select Start Job at Step
- Ready!!
BI - Load an Excel File to DB
The purpose is to upload an Excel file into a Database without duplicate information.
- Install SQL Server Data Tools for Visual Studio 2012
- Create a New Project
- Type: Integration Services Project
- Create New Package
- Menu: Project -> New SSIS Package
- Inside the Package
- In the tab Control Flow , drag a "Data Flow Task"
- Inside the Data Flow tab, drag the following Items, as the image
- Excel Source
- OLE DB Source
- Sort elements (x2)
- Mege Join
- Conditional Split
- Data Conversion
- OLE DB Destination

Excel Source
- Double click in the element
- In Connection Manager, Select "New" and then choose the file path

- Select the Excel tab

- In Columns, select all the items

OLE DB Source
- Double click in the element
- In Connection Manager, Select "New" and then choose the Server Name and Table
- Click Ok

- Select the table where you are comparing the information (is the same table where you are going to store the new data)

- In Columns, select all the items
- Click OK
SORT
- Double click in the left Sort
- Select the key that you want to use to compare

- Do the same for the right Sort, selecting the same key to compare
MERGE JOIN
- Double click in the Merge Join
- Select in Join Type: Left outer join
- Select all the left colums and only the key in the right table
- Change the Output Alias for the right key
- Click OK

CONDITIONAL SPLIT
- Double click in the Conditional Split
- Open the Colums Menu at the left and drag and drop the right key to the down part
- Change the conditional to ISNULL([NewCodigo])
- Connect to DATA Conversion with the line "New Rows"

DATA CONVERSION
- Double click in the element
- Change the Data Type as in the image, especially in "Codigo"

OLE DB DESTINATION
- Select the connection manager
- Select the table to store the new rows
- Save the project
TEST
- Execute the Package
- Do a select query to review the new data added
jueves, 8 de agosto de 2013
martes, 6 de agosto de 2013
BI - Introduction
Leading Up to Business Intelligence
So, exactly what does “business intelligence” mean? The authors could provide a simple, tool-centric definition, but we have decided to give you the context that can help you make the most sense of what BI is, why it’s important, and what forces are driving its popularity.
Observations from Steven R. Covey’s book, The Seven Habits of Highly Effective People, show that an airplane that travels from Boston to Los Angeles is off-course for 90 percent of the journey, but the airplane successfully reaches its destination because the pilot makes continuous course corrections based on instruments that monitor the flight and provide feedback.
Much like an airplane, if a company is not steered, it will inevitably be off course more than 90 percent of the time. Most companies have a goal or destination and, to gain necessary business insights, use instruments or measurement tools to help monitor and analyze past, current, and projected future performance. Those insights give managers the information they need to make changes, or “course corrections.” Insights come in the form of reports, scorecards, KPIs, dashboards, and other information vehicles, driven by a concept called “trusted data.”
These scorecards, dashboards, KPIs, reports, and other tools can help a company see the relationships between their business and its highest priorities and strategies. Decision-makers want the visual experience that dashboards offer so that they can feel as if they’re driving their company to its destination.

Fortunately, airplanes are predictably more successful at reaching their destinations than companies are in successfully reaching their goals. Is this success due to the science and precision of the measurement tools used in the aviation industry?
Over the years, weather conditions, patterns, and other variables that affect flight and direction—originally considered unmeasurable—have become increasingly measurable. New instruments were developed and produced to give pilots precise location coordinates. Now the same is occurring for businesses. Douglas W. Hubbard, in his book How to Measure Anything; Finding the Value of “Intangibles” in Business, lists a few real-life examples of variables that companies previously chose not to measure because they were presumed to be unmeasurable, including:
- Management effectiveness
- Productivity of research
- Risk of bankruptcy
- Quality
Accounting professionals and academics, including Robert S. Kaplan, Baker Foundation Professor at Harvard Business School, have developed methodologies for measuring many elements in business that were previously thought of as unmeasurable in the performance of companies. Kaplan and David Norton proposed the concept of a Balanced Scorecard (BSC) as a means of measuring the performance of a business strategy. The BSC encapsulates four main areas that capture performance metrics:
The preceding four areas can be simply referred to as Finance, Operations, Sales, and Human Resources or—to simplify even further—FOSH metrics.
Additional perspectives can include community and social impact, government relations, and others. These measures of success are sometimes called critical success factors. The BSC and other methodologies, such as Six Sigma,[1] help companies follow the pattern shown in the following illustration.

A company vision statement or mission statement is important for getting a company to focus on what makes it successful. Someone said, “You must stand up for something, or you will fall for everything.” The vision statement helps a company filter which voices it will listen to, because the vision defines its purpose and reason for existence. Typically, upper management communicates the vision or mission statement to the company.
A strategy is a set of policies, procedures, and approaches to business that is intended to produce long-term success. The strategy reflects the mission of the company.
The mission is also used to develop measurable objectives. When established, objectives help determine KPIs, which are quantifiable measurements that reflect critical success factors.
KPIs allow for monitoring of metrics that are aligned with principal objectives. Then managers or employees can analyze issues that surface from data that indicate conditions that need more attention (once called “exception reports”). Action can then be taken to “correct the course” so that the company reaches its destination.
For illustration purposes, the following example shows how an organization designs a KPI, turning data into actionable information:
- Strategy: . To improve Mtn. Bike customer’s satisfaction
- Objective: . To increase repeat Mtn. Bike customer store sales by 20 percent
- KPI: . The number of quarterly repeat sales for Mtn. Bike customers
To achieve the objectives, the decision-makers in the company ask the following questions about the business:
- What has happened? (monitoring)
- What is happening? (monitoring)
- Why is it happening? (analyze)
- What will happen? (forecast based on analyzing)
Part of the problem when trying to arrive at the answers to these questions is that much of the data needed is in a raw format stored in line-of-business (LOB) systems and other disparate business areas. Chapter 3, explains how companies accomplish providing access to this data in a usable form.
Suscribirse a:
Entradas (Atom)